Pricing study

Find the optimal price for your products to maximise your revenues and build long-term consumer loyalty

A pricing study identifies the ideal price customers are willing to pay for your product/service and allows you to test price adjustments in comparison to packaging size changes. With the insights generated you will be able to measure demand elasticity, identify the optimal pricing points for adjusted pricing and set the basis to maximise your profits.
Key insights
By performing a pricing study you can optimise your pricing strategy basing your decisions on:
Overview of the price elasticity in relation to the demand of your product/service at different pricing levels
Optimal price level for one or more products/services according to consumer preferences
Product or service value for money indicators
The highest ROI identified and the related product pricing
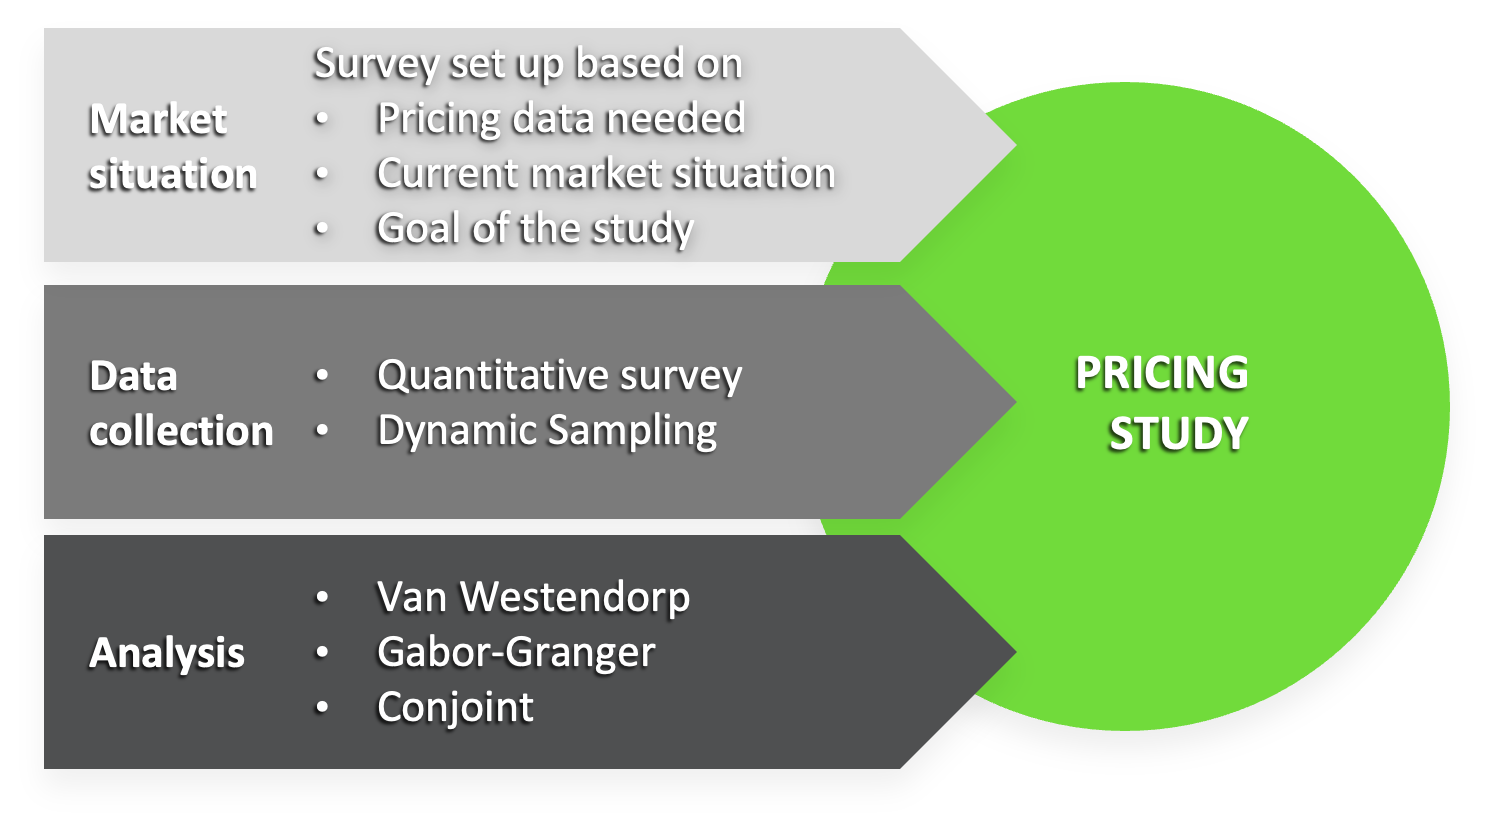
Technical set-up
Pricing studies can be conducted as part of the product innovation and/or launch, to test price levels and elasticity due to changes in market conditions and competition. Depending on the aim of the study, the survey will be set-up and analysed using:
Van Westendorp (four questions on prices)
Gabor-Granger (uses predefined price levels)
Conjoint analysis (uses predefined price levels and attributes)
Price test with Van Westendorp
There is not an established price for the product (e.g., new product, or new market)
Actual demand not predicted at specific price points
Determine how much consumers are willing to pay
The product is ready, the only thing that can change based on the results is the price
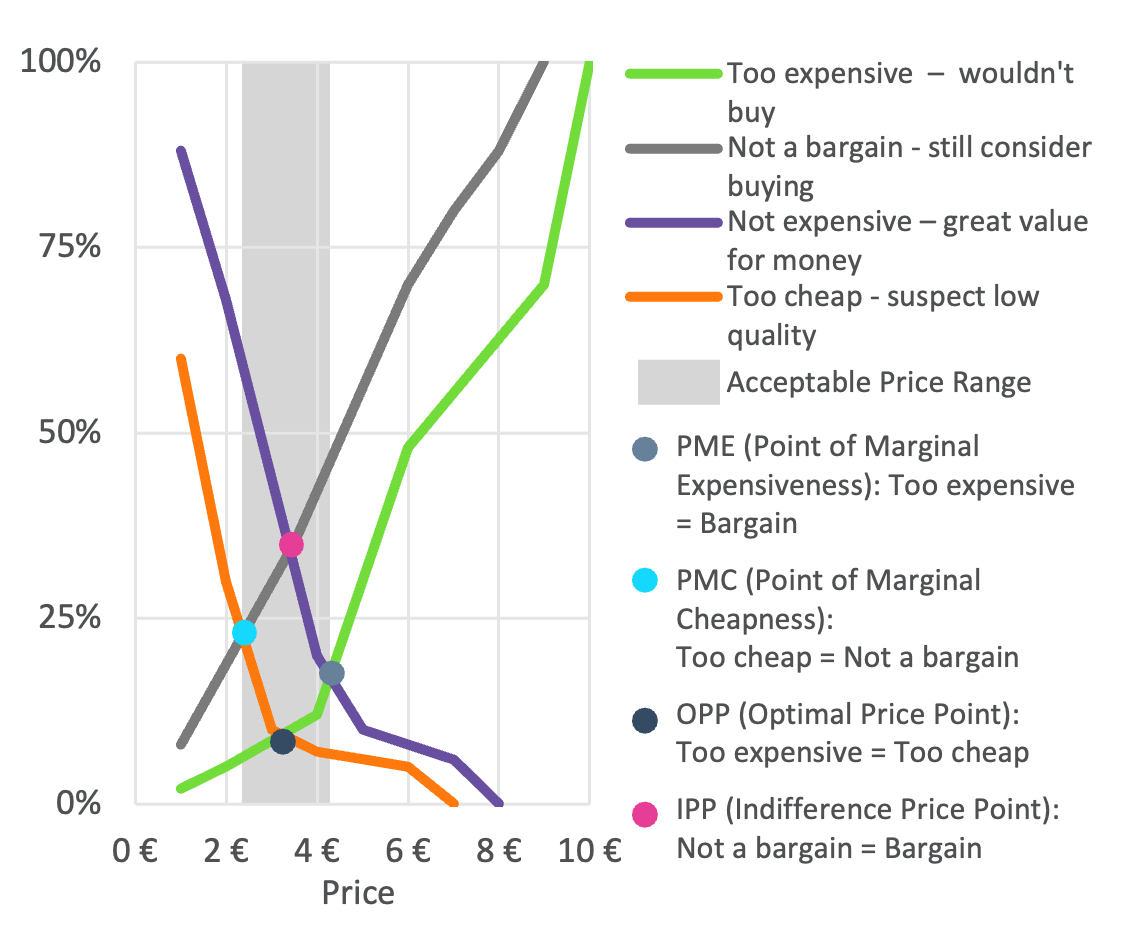
The results identify a range of acceptable prices, the Optimal Price Point is not the only possible “best” price
The Van Westendorp Price Model
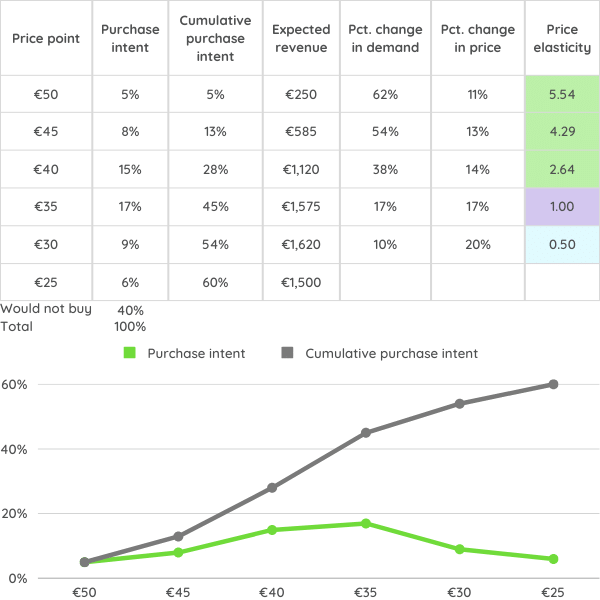
Price test with Gabor-Granger
Used to identify price elasticity, predict estimated revenues and understand how price changes affect sales volume
The product is already introduced in the market
Aim to optimise and predict revenue/profit
Market shares of competitors should be estimated
The data is processed using an inverse cumulative distribution to uncover price elasticity of demand
The results show the total proportion of customers willing to buy the product and the revenue-maximising price
Price Elasticity with Gabor-Granger
Price test with conjoint analysis
Understand the importance of price relative to other attributes (e.g., price, color, brand, size)
Identify the impact of attributes on consumers perceived value of the product and their desired combination
Uncover market shares, also of competitor brands, and purchase intent for different options
The research can be done as a choice-based conjoint or an adaptive choice-based conjoint
Product attributed and attribute levels should be predefined

Conjoint price analysis
Pricing Studies Optimise Your Revenue Potential & Give You a Competitive Advantage

How Tyson Foods optimised the base price per unit
“The survey results are very interesting, we got a clearer picture of the category consumers, how our brand performs and how to improve the brand performance with marketing communication. We also saw clear indications that we can optimise the base price per unit. We will be using the results to adjust the target groups for the digital marketing campaigns."

Tjerk Boorsma
Marketing Intelligence & Consumer Insights Specialist

Pricing research 101: setting the right price for market success
Trying to pin down the optimal price for your product can make you feel like you need an advanced economics degree, doesn’t it? With competitors playing games and budgets still recoiling from recent hits, one wrong move could severely impact your growth trajectory.
But rest assured—proven pricing research methodologies can transform the guesswork into a clear strategic compass.