

The Youth Market in 2026: Must-Know Trends for Brands
Updated: July, 2026
Published: April, 2025
Opeepl's ongoing Youth Pulse Study, conducted across the EU5 countries, tracks how young consumers' media habits, attitudes, values, and purchasing behaviour evolve over time. The latest wave — Wave 5 (February 2026) — reveals a generation navigating a period of cautious optimism: their financial outlook remains relatively stable, yet spending expectations have softened slightly. Against this backdrop, Gen Z anf younger millennials continue to shape the market in meaningful ways — from how they spend time on social media and which influencers they trust, to what they eat, drink, wear, and invest in when it comes to personal care.
This article brings together the key trends across six categories — social media habits, food, non-alcoholic beverages, alcoholic beverages, fashion, and personal care — to give brands a broad picture of where the youth market stands in 2026.
Unless otherwise noted, data in this article reflects Wave 5 of our Youth Pulse Study (Q1 2026), covering 15–30 year olds. Some sections draw on Wave 4 (Q2 2025) and Wave 3 (Q3 2024), where those questions were not repeated in later research waves. Wave 3 covered a slightly narrower age group of 15–27 year olds.
Media Habits: Key Trends
Here are the key trends in social media habits, as revealed by the research.
94% of Young Consumers Use Social Media
Social media is the dominant media channel among Gen Z and younger millennials in 2026, with 94% using it and spending an average of 3.27 hours per day on social platforms. Streaming platforms come second, used by 66% of young consumers who spend an average of 2.39 hours daily. Traditional media like TV and radio are far less popular, with usage rates of 25% and 18% respectively (Opeepl Youth Pulse, Wave 3). For more insights into social media usage among 15-30 year olds, check our blog post How Gen Z and Younger Millennials Use Social Media: Insights for Brands.
YouTube Leads on Reach, TikTok on Time Spent
YouTube has the highest reach among 15–30 year-olds (77%), followed by Instagram (74%), WhatsApp (72%), and TikTok (69%). However, TikTok is where young people spend the most daily time (2.45 h), followed by WhatsApp (2.39 h) and Instagram (2.21 h) — meaning reach and engagement do not always align. For brands, a platform strategy based on reach alone risks missing where attention is actually concentrated. Our study also reveals that males and females differ considerably in terms of platforms used - for more details, see our blog post Social Media Trends among 15-30 y.o.: How Males and Females Differ in Platforms and Influencer Impact.
Virtual Product Spending Holds Steady at 24%
15–30 year-olds allocate an average of 24% of their leisure spending to virtual products — such as apps, games, subscriptions, and digital media like music and videos (Opeepl Youth Pulse, Wave 4).
Social Commerce Is on the Rise
35% of young consumers have bought something directly from social media — up 7 percentage points since Wave 4 (April 2025). Adoption varies considerably by country: 54% of young consumers in the UK have made a social media purchase, compared to 27% in Spain and Italy.
Influencer Trust and Sales Are Recovering
After a dip in late 2024, influencer trust has bounced back. Currently, 25% of 15–30 year-olds trust influencer recommendations more than traditional advertising, and 47% have purchased a product based on an influencer recommendation — returning to May 2024 levels. Our blog post How Social Media Influencers Are Shaping Youth Buying Habits in 2026 dives deeper into this topic.
Food Category: Key Trends
Here are the key trends in the Food category, as revealed by the research.
38% of Young Consumers Follow a Diet
Research on youth food lifestyles shows that 62% do not follow any specific diet. Meanwhile, 6% follow a dairy-free diet, 6% practice intermittent fasting, 5% are vegetarian, 5% follow a gluten-free diet, 4% are flexitarian, and 4% are vegan. Additionally, 2% of 15-30 y.o. are pescatarian, 3% follow the keto and 2% follow the paleo diet.
Plant-Based Meals Popular among Non-Vegans and Non-Vegetarians
Plant-based meals are popular among non-vegetarian and non-vegan consumers as well. In fact, 48% of young consumers who don’t identify as vegan or vegetarian have at least one plant-based meal per week. Females are much more likely to eat plant-based meals than males—69% of females who don’t identify as vegetarian or vegan do so, compared to 61% of males. Read more about plant-based consumers in our blog post The Rise Of Plant-Based Consumers In 2026.
Young Shoppers Are Primarily Worried about Sugar and Calories
33% of youth cite sugar content as their primary health concern when choosing food, while 31% are concerned about calorie count in food products. Other key concerns include fat content - 29%, artificial ingredients/preservatives - 22%, protein content - 20%, GMO - 14%, and sustainability of ingredients - 14% (Opeepl Youth Pulse, Wave 3).
Added Vitamins Are the Top Wish for Fortified Foods
37% of young consumers say they would like to see more food options with added vitamins, and 26% would like more options with added minerals. Other desired fortified foods include those with added fibre - 20%, omega-3 fatty acids - 17%, antioxidants - 12%, probiotics - 12%, and collagen - 11% (Opeepl Youth Pulse, Wave 3). Discover more food trends among Gen and younger millennials in our blog post 2026 Food Trends Among Gen Z and Younger Millennials.
4 out of 10 Dinners Are Not Cooked at Home
Saturday is the most popular day for youth to dine out or order takeaway, while Friday is the day when young consumers are most likely to eat prepared or ready-to-eat foods, such as frozen pizza. Mondays and Tuesdays are 'cooking-at-home' days, with 74% of youth preparing meals on those days. On average, 40% of youth dinners are not cooked at home (Opeepl Youth Pulse, Wave 3).
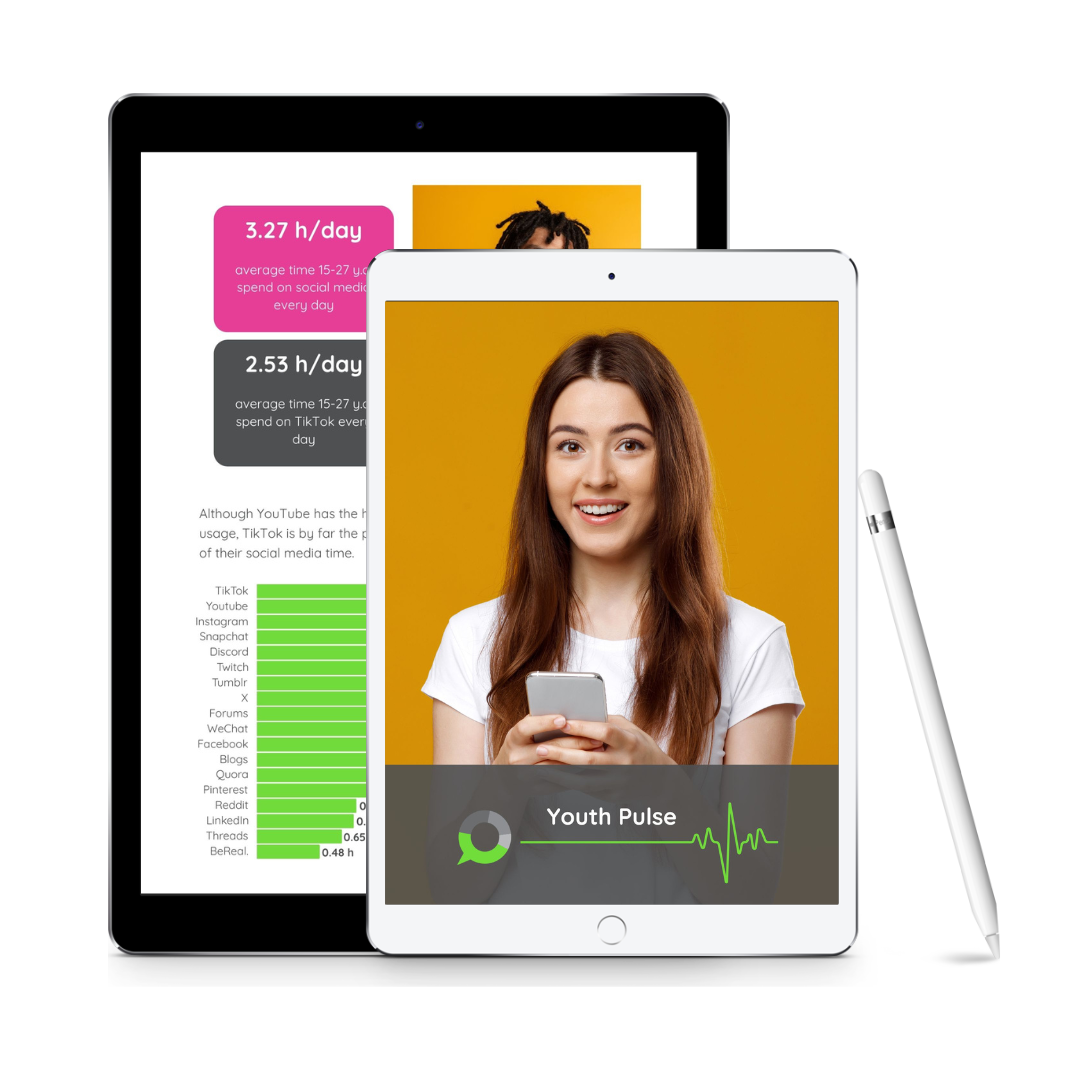
Explore the full picture: consumer confidence, media habits, values and 4 category deep dives. Download the report.
Non-Alcoholic Beverages Category: Key Trends
Here are the key trends in the Non-Alcoholic Beverages category, as revealed by the research.
Sugar Content in Beverages Is the Key Concern
39% of Gen Z and younger millennials cite sugar content as their primary health concern when choosing beverages, while 20% are concerned about calorie count. 19% worry about artificial ingredients and preservatives, and 13% are mindful of caffeine content. Additionally, 27% of youth have no concerns when choosing non-alcoholic beverages.
Youth Choose Beverages Based on Taste and Price
Taste (63%) and price (48%) are the top factors in young consumers' beverage choices. Meanwhile, 21% buy beverages based on nutritional content (e.g., low sugar, vitamins), 16% choose beverages based on the brand's reputation, 14% look for convenience (e.g., single-serve, convenient packaging), and 13% seek out beverages with organic or natural ingredients (Opeepl Youth Pulse, Wave 3).
51% Would Pay More for Sustainable Beverages
21% of youth say that sustainability is an important factor in their choice of beverages, and 51% are willing to pay more for sustainable beverages. On average, young consumers would pay up to 6% more for sustainable beverages (Opeepl Youth Pulse, Wave 3).
Beyond Water: Juice and Soda Are the Top Drinks among Youth
72% of young consumers drink juice, and 68% drink soda at least once a month, while 15% consume these beverages daily. Coffee ranks as the number one drink for daily consumption, with 26% of youth drinking it every day (Opeepl Youth Pulse, Wave 3).
Youth Want More Beverage Options with Added Vitamins
Added vitamins are the top wish for fortified beverages among 15-30 year olds, with 43% expressing interest. Additionally, 26% would like more beverage options with added minerals, 22% with added protein, 12% with added antioxidants, 12% with added collagen, and 11% with added probiotics.
Wondering what's next in beverages? We've identified 10 emerging trends shaping the category in 2026 — explore them in our blog post Beverage Trends Among Gen Z and Younger Millennials: How Brands Can Stay Ahead.
Alcoholic Beverages Category: Key Trends
Here are the key trends in the Alcoholic Beverages category, as revealed by the research. Only respondents
52% of Gen Z and Younger Millennials Consume Alcohol
47% of young females and 56% of young males consume alcoholic beverages. In terms of quantity, 34% have 1-6 units per week, 7% have 7-14 units, 5% have 15-21 units, 4% have 22-28 units, and 3% have more than 28 units per week. Only respondents over 18 were asked further questions about this category (Opeepl Youth Pulse, Wave 4).
Brick-and-Mortar Stores Lead in the Purchase of Alcoholic Beverages
While 79% of youth purchase alcoholic beverages in physical stores, only 3% buy them exclusively online. Among the EU5 countries, purchasing alcoholic beverages online is most common in Germany, with 34% opting for this method, while in Spain, only 14% of young consumers choose to buy alcohol online (Opeepl Youth Pulse, Wave 3).
Beer and Cocktails Dominate Youth’s Drink Scene
70% of young consumers drink beer, and 57% drink cocktails at least once a month. Nearly half of young consumers—48%—drink beer at least once a week. Beer is significantly more popular among males, with 80% drinking it at least once a month, while cocktails are favoured by females, with 63% enjoying them (Opeepl Youth Pulse, Wave 3).
Health or Lifestyle Choices Are the Main Motivation to Choose Alcohol-Free
When asked about their primary motivation for choosing non-alcoholic versions of alcoholic beverages, 34% of youth cite health or lifestyle choices (e.g., low calories, sober lifestyle). Another 29% mention social situations (e.g., being a designated driver or attending a work event), 23% say they are curious and want to try something new, 21% attribute it to personal preference (e.g., enjoying the taste of alcohol-free options), and 19% cite temporary reasons, e.g., pregnancy, medication, or fitness goals (Opeepl Youth Pulse, Wave 3).
13% Would Like to Switch to Alcohol-Free Versions More Often
15% of young consumers say that they often choose non-alcoholic versions of alcoholic beverages, and another 23% drink them occasionally depending on the situation. 13% say that they would like to switch from alcoholic beverages to non-alcoholic versions more often; however, 6% of those find it difficult to switch (e.g. due to peer pressure). 48% of 18–30 year-olds rarely or never have non-alcoholic versions of alcoholic beverages (Opeepl Youth Pulse, Wave 4). Across beverage categories, non-alcoholic versions are most popular for cider and hard seltzers: 28% of youth drink non-alcoholic cider, and 34% choose non-alcoholic hard seltzers (Opeepl Youth Pulse, Wave 3).
Read more about alcoholic beverages trends among 18-30 y.o. consumers in our blog post The Shift In Young Consumers’ Alcohol Consumption: Trends & Insights.
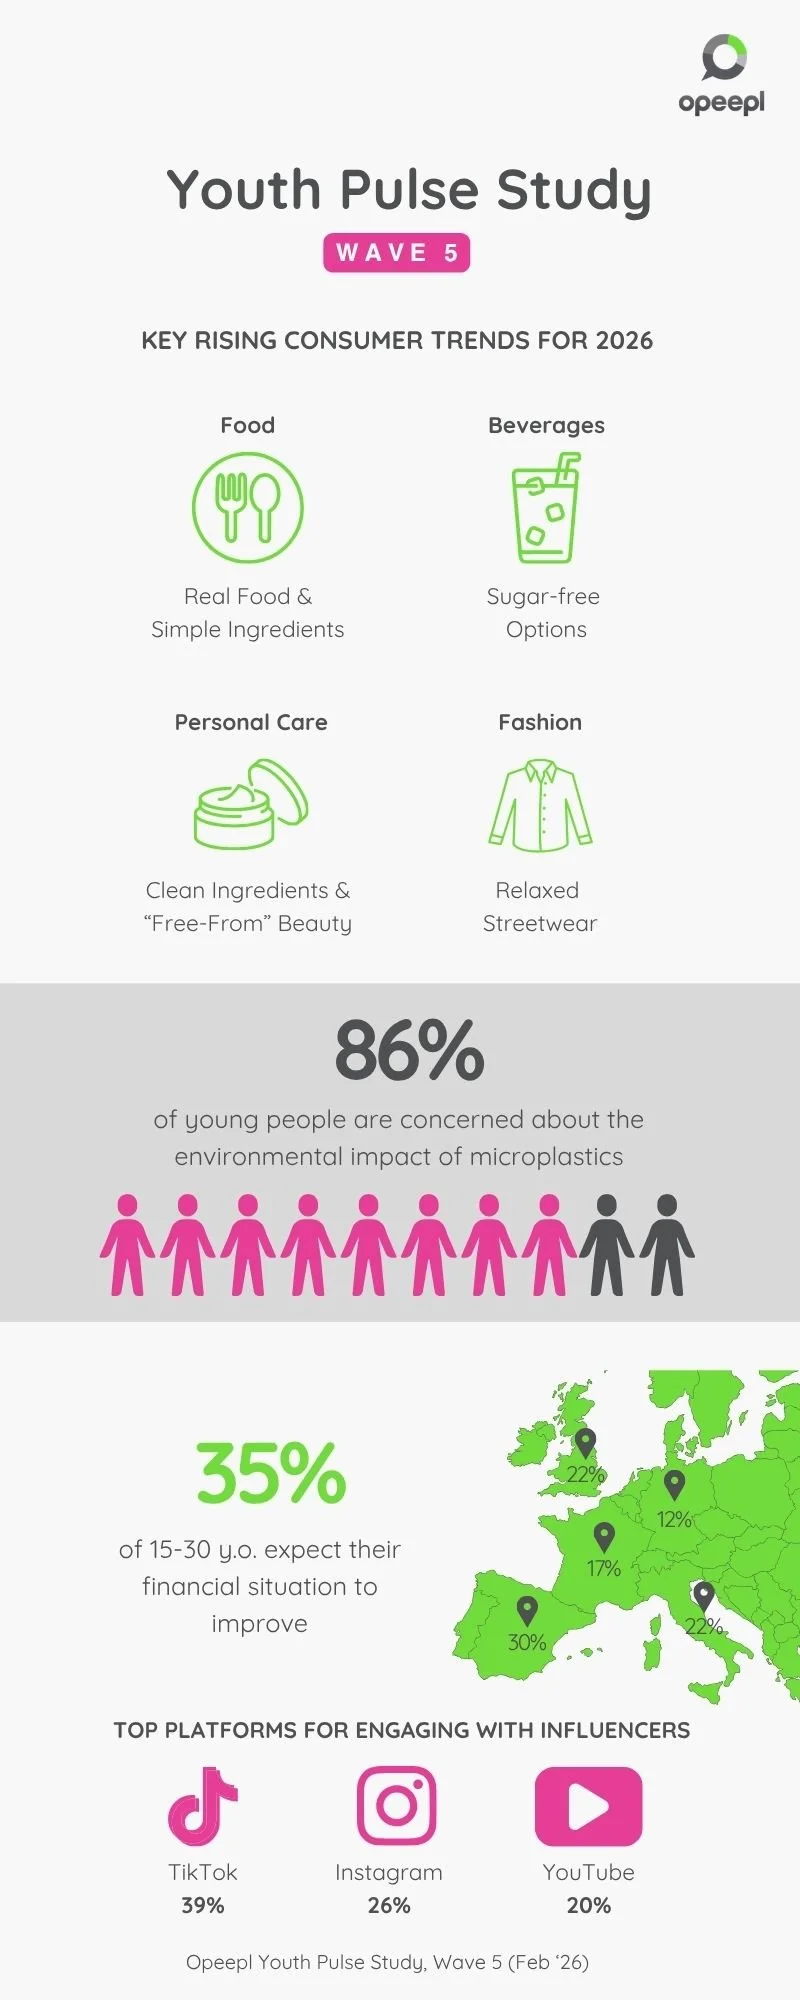
The Youth Pulse Wave 5 Report offers even more insights on 15-30 y.o. Here's a preview of what's inside:
Fashion Category: Key Trends
Here are the key trends in the Fashion category, as revealed by the research.
Click to Closet: 83% of Youth Buy Apparel Online
A significant 83% of 15-27-year-olds shop for apparel online, with females (87%) leading the trend over males (79%). While 17% of young consumers still shop exclusively in physical stores, only 5% rely solely on online platforms. Physical stores continue to play a big role by offering hands-on experiences and instant gratification (Opeepl Youth Pulse, Wave 3).
Young Shoppers Focus on Price and Style
Young consumers prioritise price, style, and quality when making fashion decisions, with affordability being the top factor (57%), followed by style and design (54%) and quality and durability (49%). 34% seek versatile and comfortable clothing, and 25% take brand image into account (Opeepl Youth Pulse, Wave 3).
Social Media: The Fashion Inspiration Playground
When we look at where young consumers draw their inspiration, it's no surprise that social media tops the list. Social media is the primary source of fashion inspiration for 43% of youth, followed by physical stores (40%) and online retailers (29%). Other influences include friends and family recommendations - 28%, street style - 28%, fashion bloggers and influencers - 14%, TV shows and celebrities - 12%, and fashion magazines/print media - 12% (Opeepl Youth Pulse, Wave 3).
Young Consumers are Embracing Pre-Loved Fashion
The trend of second-hand shopping is growing, with 73% of youth combining new and pre-loved items, and 5% buying exclusively second-hand clothes. Price is the main motivator (57%), but unique or vintage finds (33%) and sustainability (31%) also play important roles. 23% choose second-hand fashion because of personal style and individuality, 21% want to support local businesses or charities, and 16% prefer the quality of items compared to fast fashion.
Sustainability: Youth Cares, But Doesn't Always Act
Though 59% of youth recognise sustainability issues in the fashion industry, only 30% take it into account when making actual shopping decisions. However, 66% are willing to pay a premium for sustainably produced clothing, indicating interest in eco-friendly fashion when it aligns with other values. On average, young consumers are ready to pay up to 10% more for sustainable fashion (Opeepl Youth Pulse, Wave 3).
For a deeper dive into the second-hand fashion and 10 emerging fashion trends for 2026, see our blog post Youth Fashion Trends 2026: Second Hand Growth And 10 Trends To Watch.
Personal Care & Cosmetics Category: Key Trends
Here are the key trends in the Personal Care & Cosmetics category, as revealed by the research.
Buying Personal Care Products Online is Popular Among Youth
56% of youth combine both online and offline shopping when purchasing personal care products, while 5% shop exclusively online. Buying personal care and cosmetics products online is much more popular among females—67% do so compared to 54% of their male counterparts (Opeepl Youth Pulse, Wave 3).
19% of Gen Z and Younger Millennials Are Highly Invested in Personal Care
When asked to categorise themselves in terms of their personal care lifestyle, the largest proportion of youth (38%) identified as moderately invested—they care about personal care but keep it simple. Another 19% described themselves as highly invested, prioritising and regularly spending on personal care and cosmetics. Meanwhile, 30% identified as low maintenance, preferring a minimal routine with basic products, and 14% said they are uninterested, putting little thought or effort into personal care.
Social Media Is the Primary Source for Discovering New Products
50% of youth discover new personal care and cosmetics products on social media, while 30% find them by browsing in-store. Additionally, 32% rely on recommendations from friends or family, 19% discover products through advertisements, 15% draw inspiration from online retailers or e-shops, and another 13% from beauty bloggers or influencers.
Clean Beauty and Minimalism Are Top Trends Among Youth
When asked about recent trends adopted in their personal care routines, 29% of youth cite clean beauty (using non-toxic, safe, or natural ingredients). Additionally, 24% embrace minimalism by using fewer, multi-purpose products, while 13% adopt the sustainable beauty trend by prioritising eco-friendly packaging and products. Meanwhile, DIY skincare (creating their own skincare products at home) is popular among 11% of youth (Opeepl Youth Pulse, Wave 3).
46% Say It Is Important That Brands Offer Inclusive Product Options
12% of youth use products designed for all genders. Nearly half (46%) of young consumers say it is important for brands to offer inclusive product options (e.g., for different skin tones, hair types, and gender-neutral products). This trend is more prominent among females—63% of young females say that inclusive product options are important (Opeepl Youth Pulse, Wave 3).
Check out out blog post 2026 Personal Care & Cosmetics Trends among Young Consumers for more insights and key emerging trends for 2026 and beyond.
What This Means for Brands
The youth market in 2026 is not a single story — it's six different ones playing out across social media, food, beverages, fashion, and personal care. What unites them is a generation that is engaged, opinionated, and increasingly difficult to reach through traditional channels alone.
A few themes stand out across categories: social media is the primary discovery channel for both products and trends; price remains the dominant purchase driver, but sustainability and health are steadily gaining ground; and the gap between what young consumers say they value and what they actually buy remains real and measurable.
For brands, the opportunity lies in understanding these nuances at a category level — and tracking how they shift over time. By the next wave of the Youth Pulse Study, some of these trends will have moved. Stay tuned for more youth market insights.

Download our latest Youth Pulse Report
Opeepl Youth Pulse is a bi-annual study that keeps pulse on the latest developments in the youth market. Discover key youth trends in consumer confidence, media habits, attitudes, values, and four major categories: Food, Beverages, Fashion, and Personal Care.